You are using an out of date browser. It may not display this or other websites correctly.
You should upgrade or use an alternative browser.
You should upgrade or use an alternative browser.
LOCK, DELETE.
- Thread starter deacphan
- Start date
- Latest activity Latest activity:
Bronson Pinchot
Sam Cronin
- Joined
- Aug 30, 2012
- Messages
- 2,262
- Reaction score
- 309
Prince Fielder just got caught stealing by about 10 feet.
YoungBuck95
Well-known member
- Joined
- Mar 30, 2011
- Messages
- 23,146
- Reaction score
- 5,648
Cashman has serious interest in Chipper. Chip ain't coming out of retirement for the yanks.
avalon
Antwan Scott
- Joined
- Mar 29, 2011
- Messages
- 18,713
- Reaction score
- 1,341
Prince Fielder just got caught stealing by about 10 feet.
Haha, just wanted to post a quick reminder that Prince Fielder has two inside the park home runs.
vs. the Blue Jays
vs. the Twins
IAppreciateIt
no bunting allowed
- Joined
- Mar 15, 2011
- Messages
- 14,393
- Reaction score
- 4,324
nice jordany valdespin took verlander deep
Bronson Pinchot
Sam Cronin
- Joined
- Aug 30, 2012
- Messages
- 2,262
- Reaction score
- 309
Super insightful headline/article here: Someone will close for the Tigers, they just don't know who
you can't negrep me for this, deacphan:
http://www.baseballnation.com/2013/3/11/4088616/the-underratedest
http://www.baseballnation.com/2013/3/11/4088616/the-underratedest
IAppreciateIt
no bunting allowed
- Joined
- Mar 15, 2011
- Messages
- 14,393
- Reaction score
- 4,324
and a decent part of zorilla's value comes from his versatility, which isn't even taken into account when just looking at war
IAppreciateIt
no bunting allowed
- Joined
- Mar 15, 2011
- Messages
- 14,393
- Reaction score
- 4,324
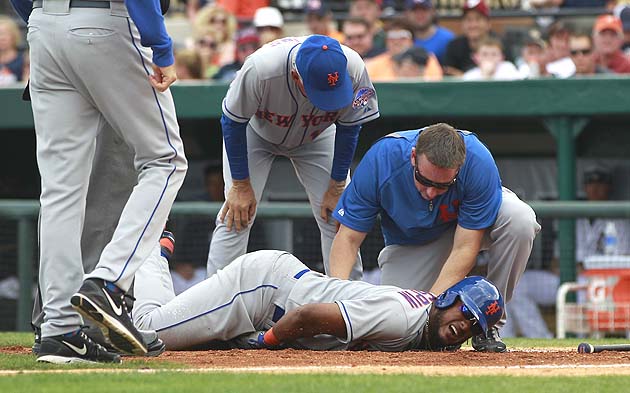
After being plunked by Verlander:
Mike Puma Mike Puma @NYPost_Mets
Valdespin says he is OK ... Asked where he got hit: "My dick," Valdespin said.
Mike Puma Mike Puma @NYPost_Mets
Valdespin says he is OK ... Asked where he got hit: "My dick," Valdespin said.
YoungBuck95
Well-known member
- Joined
- Mar 30, 2011
- Messages
- 23,146
- Reaction score
- 5,648
After being plunked by Verlander:
Mike Puma Mike Puma @NYPost_Mets
Valdespin says he is OK ... Asked where he got hit: "My dick," Valdespin said.
Wasn't wearing a cup either according to Puma. Ouch.
IAppreciateIt
no bunting allowed
- Joined
- Mar 15, 2011
- Messages
- 14,393
- Reaction score
- 4,324
Wasn't wearing a cup either according to Puma. Ouch.
still, better to the dick than the balls
Bronson Pinchot
Sam Cronin
- Joined
- Aug 30, 2012
- Messages
- 2,262
- Reaction score
- 309
94 mph too
Bronson Pinchot
Sam Cronin
- Joined
- Aug 30, 2012
- Messages
- 2,262
- Reaction score
- 309
Posnanski's take on the closer role
The Closer You Get ...
One question has fascinated me for a while now: How much have modern closers changed the game? I mean, sure, we know they have changed many things SURROUNDING the game in obvious ways.*Closers have helped change the salary structure of the game. They have changed the way managers direct a game. They have given us indelible memories -- the stomping of Al Hrabosky, the high heat of Goose Gossage, the mustache of Rollie Fingers, the Dan Quisenberry sinker ball, the unhittable pitches of Craig Kimbrel, the wonder of Mariano.
My question is just a little bit different and more focused on results: How much more often do baseball teams win games they lead going into the ninth inning now that closers rule the ninth inning?
I've written some about this before, so first I'll review a bit and then get to some relatively new stuff. We start with a surprisingly simple fact:
When teams lead the game going into the ninth inning, they win 95% of the time.
No, the number is not all that surprising -- I suspect all of us would probably have guessed that teams leading going into the ninth win somewhere around 95%. What's surprising is how constant that statistic has been through the years -- teams winning 95% of the time they lead going into the ninth is pretty close to a universal truth.*It was true in the 1950s. It was true in the 1960s. It was true in the 1970s and 1980s and 1990s and 2000s.
Last year, 2,206 teams led going into the ninth inning, and 2095 of them won -- that's 95%.
Of course, it's never EXACTLY 95% -- last year, for instance, it was 94.968% -- so there are small fluctuations which we will talk about in a minute. But do those fluctuations mean anything? If you fairly flip a coin 2,000 times, it almost certainly will not land on heads exactly 1,000 times and tails exactly 1,000 times. We still know that it's a 50% chance of heads or tails. And it's a 95% chance for teams to hold on to their ninth inning leads -- the consistency of this number is staggering.
An example: In 1945, baseball was a different game. Almost all the baseball stars of the time*were fighting World War II. The game was affected. Nobody in baseball hit 30 home runs that year. Guys like Stuffy Stirnweiss and Nels Porter and Steve Gromek were stars. It was disorienting.
In 1945, teams that led going into the ninth inning won 95% of the time.
The star players came back in 1946. Ted Williams led the league in on-base percentage, slugging percentage, total bases. Stan Musial hit .365. Hank Greenberg was back and he led baseball with 44 homers. Bob Feller pitched 371 innings (THREE HUNDRED SEVENTY ONE! It looks even more amazing in word form) with 36 complete games (THIRTY-SIX!) and he struck out 348 batters. Baseball was back.
In 1946, teams that led going into the ninth inning won 95% of the time.
The sheer stubbornness of this statistic is pretty remarkable. Baseball teams, through the years, have tried many different strategies to hold on to their ninth inning leads -- some interesting, some provocative, some seemingly stupid. And while, in the short term, they might cause a few ripples, the long term percentage never changes. It stays at 95%.
So, you might ask: If the percentage is so constant (and so high), why do teams try all these new strategies? Why do they spend so much money on closers? It's a provocative question. I do think that the idea of winning every single game you lead going into the ninth is SO tantalizing -- it seems SO achievable -- that teams just can't help themselves. And it's something easily documented. In 2011, the Baltimore Orioles lost four games they were leading going into the ninth. In 2012, they lost only one. It's easy to say this made a huge difference between 93-loss 2011 Orioles and the 93-win 2012 Orioles.*
*I suspect the bigger difference was that 2011 Orioles led going into the ninth inning 63 times, the 2012 Orioles led going into the ninth inning 76 times. Well, that and the Orioles freakish 16-2 record in extra innings.
There's something else. I think, that drives teams' constant effort to cut into that one time in 20 that they blow a lead in the ninth inning: Emotion. When teams DO blow a game in the ninth, it hurts like a monster. Everybody takes these kinds of losses much harder than the garden variety 6-2 loss. I think teams overcompensate *because of that.
So, how much can new strategies affect the game? Well, if you look at the big picture, you have to go to the next decimal to find the differences:
1950s: .948
1960s: .946
1970s: .948
1980s: .951
1990s: .949
2000s: .954
2010s: .952
You can see that the last dozen or so years, the win percentages HAVE gone up slightly … the closer might deserve some of the credit. We'll get into that in a second. But, how much of a difference are we talking about? In the 2000s, teams held on to 95.4% of their leads against, say, 94.8% in the 1970s. That's roughly 135 extra wins in the 2000s. That's 13.5 per season. That's fewer than half a win per team. It's not nothing. But you might argue that it's not worth the many, many, many millions teams spent to get it.
This is how far I got last time … looking at this thing through a wide-angle lens. But, as many of you pointed out, looking at "ninth inning leads" as one entity is a very incomplete way of looking at things. Obviously a five-run lead going into the ninth is very different from a one-run lead going into the ninth. Before, I had no idea how to break down the leads by runs -- Baseball Reference doesn't yet give that option (though Sean Forman says it's something they might try to do in the future) and I just don't have the dexterity to manipulate the amazing Retrosheet database that way.
Well, Tom Tango and Baseball Prospectus to the rescue. Tom pointed out that by using the Baseball Prospectus expected win matrix, you can go back to the 1960s to find what a team's win percentage would be when leading with 0 outs and 0 base runners in the ninth inning. Great, great information. Now, finally, I would see just how much closers have affected the game. Right?
Well, first thing I found is something obvious: Teams up five runs or more going into the ninth inning win just about 100% of the time. There's a fluke comeback every now and again, but it's pretty close to 100%. *Teams up four runs going into the ninth win 99% of the time. So we'll throw those out for now.
How about three runs? Well, Goose Gossage said one time that if he got a save for pitching one inning with his team up three runs, he would be "embarrassed." He's not wrong there. Teams up three going into the ninth almost always win.
Winning percentages when team leads by three runs going into the ninth inning:*
1960s: .974
1970s: .977
1980s: .975
1990s: .963
2000s: .976
You will note that the lowest win percentage is in the 1990s. This is a big theme. Yes, teams obviously were using closers in the 1990s, but teams were also scoring runs at a historic rate.
Winning percentages when team leads by two runs going into the ninth inning:
1960s: .930
1970s: .925
1980s: .941
1990s: .936
2000s: .931
The numbers are kind of all over the place -- but as you can see the winning percentage in the 2000s, with closers and setup-men and all that, almost precisely matches the winning percentage of the 1960s, when runs were hard to come by and starters often finished what they started. I'm not sure what you can learn from this. Now, to the big one.
WInning percentages when team leads by one run going into the ninth inning:
1960s: .844
1970s: .850
1980s: .852
1990s: .846
2000s: .848
And … yeah, the stat kind of pops like wet firecrackers. Not a lot to see here. Apparently, the win percentage when teams are up one entering the ninth leading doesn't change much no matter what managers do. It was .850 in the 1970s. It was .848 in the 2000s.
Sure, yes, there are many variables here, and if you wanted to do an in-depth study of comebacks you would, as Tom Tango points out, take into consideration the run scoring environment. You would also consider ballparks and many other things. But I wasn't really interested in that. I was really interested in knowing if closers have made it more likely that teams will win games they lead going into the ninth. And the answer, I believe, is no.
Now, wait a minute: You could argue that the game is constantly evolving and that teams need to use closers JUST TO MAINTAIN the status quo. That is to say, if teams tried to stretch their starters like they did in the 1970s or use their bullpen the way managers did in the 1960s, teams might come back in the ninth inning a much higher percentage of the time. Maybe the comeback rate would be 10% instead of 5%. I don't know. It's a great topic of conversation and somewhat beyond my own meager analytical skills.
But I just find it fascinating that*no matter how much everyone tries to fiddle with the last inning of a game -- closers, match-ups, specialists, pinch-hitters, whatever else -- those overall ninth-inning win percentages just do not move. I would guess that teams with great closers having great years might help a team squeeze an extra win or two in a season. Maybe. But I do wonder if all of the ninth inning tactics are about as useful as rearranging furniture.
wake20
Well-known member
Halladay better get it together soon