• Welcome to OGBoards 10.0, keep in mind that we will be making LOTS of changes to smooth out the experience here and make it as close as possible functionally to the old software, but feel free to drop suggestions or requests in the Tech Support subforum!

The Excel Help Thread

Haha it was a dumb question, so I'm glad there was a quick answer and I can move on to the next project.
 
Alright folks. Need some help (this is probably pretty simple but I am awful at Excel).

I have a column that has a lot of monthly premiums in it. This column is not tied to another column, but is the sum of a base premium and a tax, so just one number. We do not have the separation of these two because we are taking over an account from a different company, and just have to equal the total amount in each cell. We have to break it down for tax purposes though, so we need a base premium, and the taxes that you add to it to get the number in the cell.

The total in this each cell of the column is X + 2% = Column A Cell. I need to find what "X" is though.

For example:

The first cell is $109.29. What I need to find is the number that, when 2% is added to it equals $109.29.

By trial and error I can clearly get to the number eventually (it's $107.14 or $107.15), but there are 500+ numbers I have to figure out, so I'm not going to manually do it.

Ex: 107.14 + 2% = $109.28282828
107.15 + 2% = $109.293

Please help, and I can explain more clearly if need be.

Jesus Christ
 
Hey nerds, this may not be the thread for help, but I am trying to do a mail merge with a document that has data essentially with the following:
Name Region
Name Region
Name Region

And so on and so forth.

I have a document which would apply 4-8 names per page with the Region name as a header. I need to force page breaks when the Region changes on my list each time. Any recommendations?
 
This will most likely be very simple, but its the end of the day and I can't figure this out. Help a brother out?

I want to create a line graph that tracks a cumulative total of two lines over time, and also has defined rate in two more lines.
I want dates to be my x axis, being able to look back two months, and the cumulative total to be the y axis. For instance, on 8/13/17, I want line A (date 1) to have plotted out all of the dates in column 1 and have a cumulative total of 13, and line B (date 2) to have a cumulative total of 2. In addition, I want to be able to have a fixed line projection for line A and line B in the background.

Date 1Date 2
7/1/17
7/15/178/5/17
7/18/17
7/21/17
7/30/17
8/4/17
8/7/17
8/8/17
8/9/17
8/10/17
8/11/178/13/17
8/12/178/14/17
8/13/17
8/14/17
8/15/178/15/17
 
I think the data as you've presented it is insufficient to make the graph you're trying to make. My initial reaction is that you need to add a column for every date series you're measuring to sum the number of occurrences of whatever you're measuring, such that on 8/13 the cell in the "Date 1 Occurrences" column = 13 and the cell in the "Date 2 Occurrences" column has a value of 2.
 
Thanks, doing so I was able to get it to plot on the line graph. I've got a new issue though. Date 1 and Date 2 are plotted as two different lines, with a series of dates being my X-axis. Using a line chart, I only have one option for my x axis, which I used my largest column (Date 1). As a result, the cumulative totals are correct, but its attributing the total for Date 2 to the date associated with Date 1.
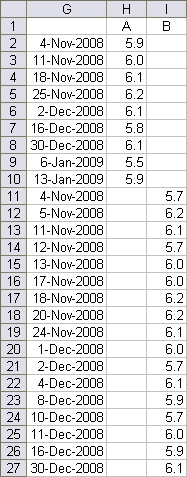
 
Thanks, doing so I was able to get it to plot on the line graph. I've got a new issue though. Date 1 and Date 2 are plotted as two different lines, with a series of dates being my X-axis. Using a line chart, I only have one option for my x axis, which I used my largest column (Date 1). As a result, the cumulative totals are correct, but its attributing the total for Date 2 to the date associated with Date 1.

You might try combining the dates into a single column and plotting Date 1 and Date 2 occurrances against it. Something like this:

LinesDataExtended.png
 
ayudame!

I have columns A - BV and rows 1 - 133.
I would like to sort first by column R, then by column BV.

There is data in each of these columns for all rows.
There is data in each row of column A.

Why are the rows with many blank cells (though not the cells being sorted) not pulling into the sort function?!

I know I can also do what I need to do by a pivot table, but this is driving me crazy.


ETA: ended up being a sneaky leading blank error, that was coincidentally on the rows with the other blank cells. Still open to other reasoning, though, if anyone knows of anything.
 
Last edited:
So I have a set of that includes a name, payroll begin and end dates in each col. I need to get an output that is name, earliest start date from col b and the max end date (col c) for each employee.. (So the different combinations would be dependent upon when the EE started, went on unpaid leave, etc.) But everyone should have a date that is the earliest start date of a pay period they were paid and the end date of the last pay period they were paid).

Name Per Start per end
Bob 1-5-18 1-19-18
Bob 1-20-18 2-3-18
Bob Jr 12-20-17 1-04-18
Bob Jr 1-5-18 1-19-18

So I want to end up with

Bob 1-5-18 2-3-18
Bob Jr 12-20-17 1-19-18

Any help including thoughts and prayers welcome. I have 3 years of biweekly payrolls to figure out.
 
Need some help

The goal is to determine the Year 1 payment for something where you know the annual percentage increase in payment and the total paid over n years. For example:

- 60 year term
- $10 million in total payments
- Assume 3% annual inflation in payment

Given that information, what formula will get me my Year 1 payment such that I can change my assumptions. I know it involves some summation calculation, but I can't figure it out.

congrats on your lotto win
 
Back
Top