You are using an out of date browser. It may not display this or other websites correctly.
You should upgrade or use an alternative browser.
You should upgrade or use an alternative browser.
Mike Trout on pace for greatest season in MLB history
- Thread starter marquee moon
- Start date
- Latest activity Latest activity:
A 5 WAR guy may be equal to a 7 WAR guy, but clearly better than the 1 WAR guy. WAR gives you an idea, but isn't definitive.
A lot of this is due to the adjustments, which remind me of the Consumer Price Index adjustments that show health care costs rise less than 2% year over year and frequently show much smaller overall CPI than almost every component in the CPI. The adjustments for Trout are undoubtedly favorable.
Season pitcher WAR leaders are similar to overall WAR leaders, as Verlander dominates almost every meaningful category on the MLB leaderboard, yet Sale is the WAR leader. So, I think Trout is getting a major park adjustment that hurts Betts, and Sale is getting major help with the same park adjustment.
And you can tell the 7 guy is better than the 1 guy with this inane so called number.
A REAL stat can't have a "tolerance on WAR must be 33% or more". That shows the methodology to be a total joke.
I LOVE Mike Trout but this is totally insane. Bonds from 2001-04 is ridiculously better. Most of the 20s for Ruth were massively better. Ted Williams had a six year period surrounding his service in WWII that were incredibly better than how Trout has started this year.
I'm sure there are dozens of other seasons better than this one. Making this statement should end the use of WAR as a viable "stat".
June reminder that Trout is still on pace for 14+ WAR. Bonds never cracked 12.
CheesePritchard
Well-known member
- Joined
- Mar 24, 2011
- Messages
- 7,356
- Reaction score
- 393
Are you factoring in the 33% tolerance?
June reminder that Trout is still on pace for 14+ WAR. Bonds never cracked 12.
Which shows how stupid the concept is.
Look at offensive slash :
Trout .447/.671/1.119
Bonds .609/.812/1.422
Bonds .582/.799/1.381
Bonds .515/.863/1.379
I love Trout. He's off to a great start, but no rational person could compare those years.
Last edited:
Which shows how stupid the concept is.
Look at offensive slash :
Trout .447/.671/1.119
Bonds .609/.812/1.422
Bonds .582/.799/1.381
Bonds .515/.863/1.379
I love Trout. He's off to a great start, but no rational person could compare those years.
You realize that WAR is a stat that attempts to compare players across different eras and offensive environments, right? Was there anything different about the run scoring environment between then and now?
thatguy2016
Well-known member
- Joined
- Feb 8, 2017
- Messages
- 10,907
- Reaction score
- 3,909
MHBDemon - I know you are in part trolling rj, and that's cool, but is it your position that WAR settles the argument, and if Trout has a higher WAR than Bonds' best year, Trout's year is definitely better, period end?
268>>206
268>>206
Do you also realize that baserunning and defense are part of baseball?
Yes, I do, but the defensive impact an outfielder can have is not as great a difference as the offense is.
BTW, here's another BS stat - Defensive Runs Saved:
"To illustrate, let's look at the DRS career of the game's consensus best player. Straight from the 2018 Bill James Handbook, here are Mike Trout's DRS totals by season:
2012: +19
2013: -11
2014: -12
2015: +5
2016: +6
2017: -6"
Any stat that shows Trout's defense to have cost the Angels runs in half of his seasons is totally full of shit. But it's another "analytic" that stat geeks swear by.
Last edited:
MHBDemon - I know you are in part trolling rj, and that's cool, but is it your position that WAR settles the argument, and if Trout has a higher WAR than Bonds' best year, Trout's year is definitely better, period end?
268>>206
If he ends up with 14+ maybe, but I don't follow this stuff as closely as I used to. There still seems to be enough variance with defense, even over a full season, that if their WARs are close, I wouldn't definitively say one season was better than the other.
Pitcher K/9
2001 - 6.74
2002 - 6.53
2003 - 6.40
2004 - 6.60
2015 - 7.76
2016 - 8.10
2017 - 8.34
2018 - 8.56
What that shows is the idiocy of Ks being more acceptable.
BTW, Bonds K'd 41/670 PAs;47/612 and 93/664 with 177, 198 and 232 BBs.
Trout already has 49Ks/273 PAs and 51 BBs.
CheesePritchard
Well-known member
- Joined
- Mar 24, 2011
- Messages
- 7,356
- Reaction score
- 393
What are your preferred measures to evaluate defense, rj?
“If statistics don’t prove what i believe to already be true, then they are bunk”
I don't have a specific analytic for defense, but any that says Trout isn't an excellent outfielder is ludicrous.
MHB makes excuses for the stats he uses. Even Baseball-Reference says WAR can't be trusted.
I explained one of the major reasons why your K stats are irrelevant. It would be like using pitch out stats now that they are down 80%.
When I use the numbers you use to prove your position is BS, you simply ignore it.
I explained one of the major reasons why your K stats are irrelevant. It would be like using pitch out stats now that they are down 80%.
When I use the numbers you use to prove your position is BS, you simply ignore it.
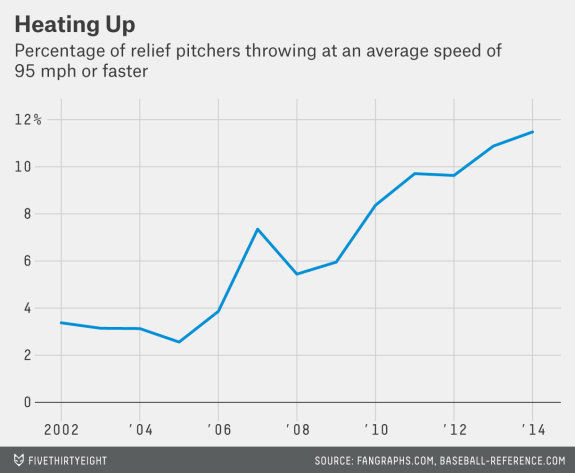
What that shows is the idiocy of Ks being more acceptable.
I'm sure it had nothing to do with this:


