This grant of rights deal will be the undoing of the ACC. Thanks Swofford. If these projections hold true, the ACC and its member institutions will not be able to keep up with their SEC brethren financially. Ultimately, the ACC and B1G will widen the gap on procuring the best coaches and best players and widen the gap in the facilities race across all sports. And then, the ACC will break apart as the biggest brands will have to make a decision between tradition and viability. This doesn't even take into account NIL or the inexorable march towards eventually paying players, which will further hamstring a league that pays out less than half of what its largest competitor does.
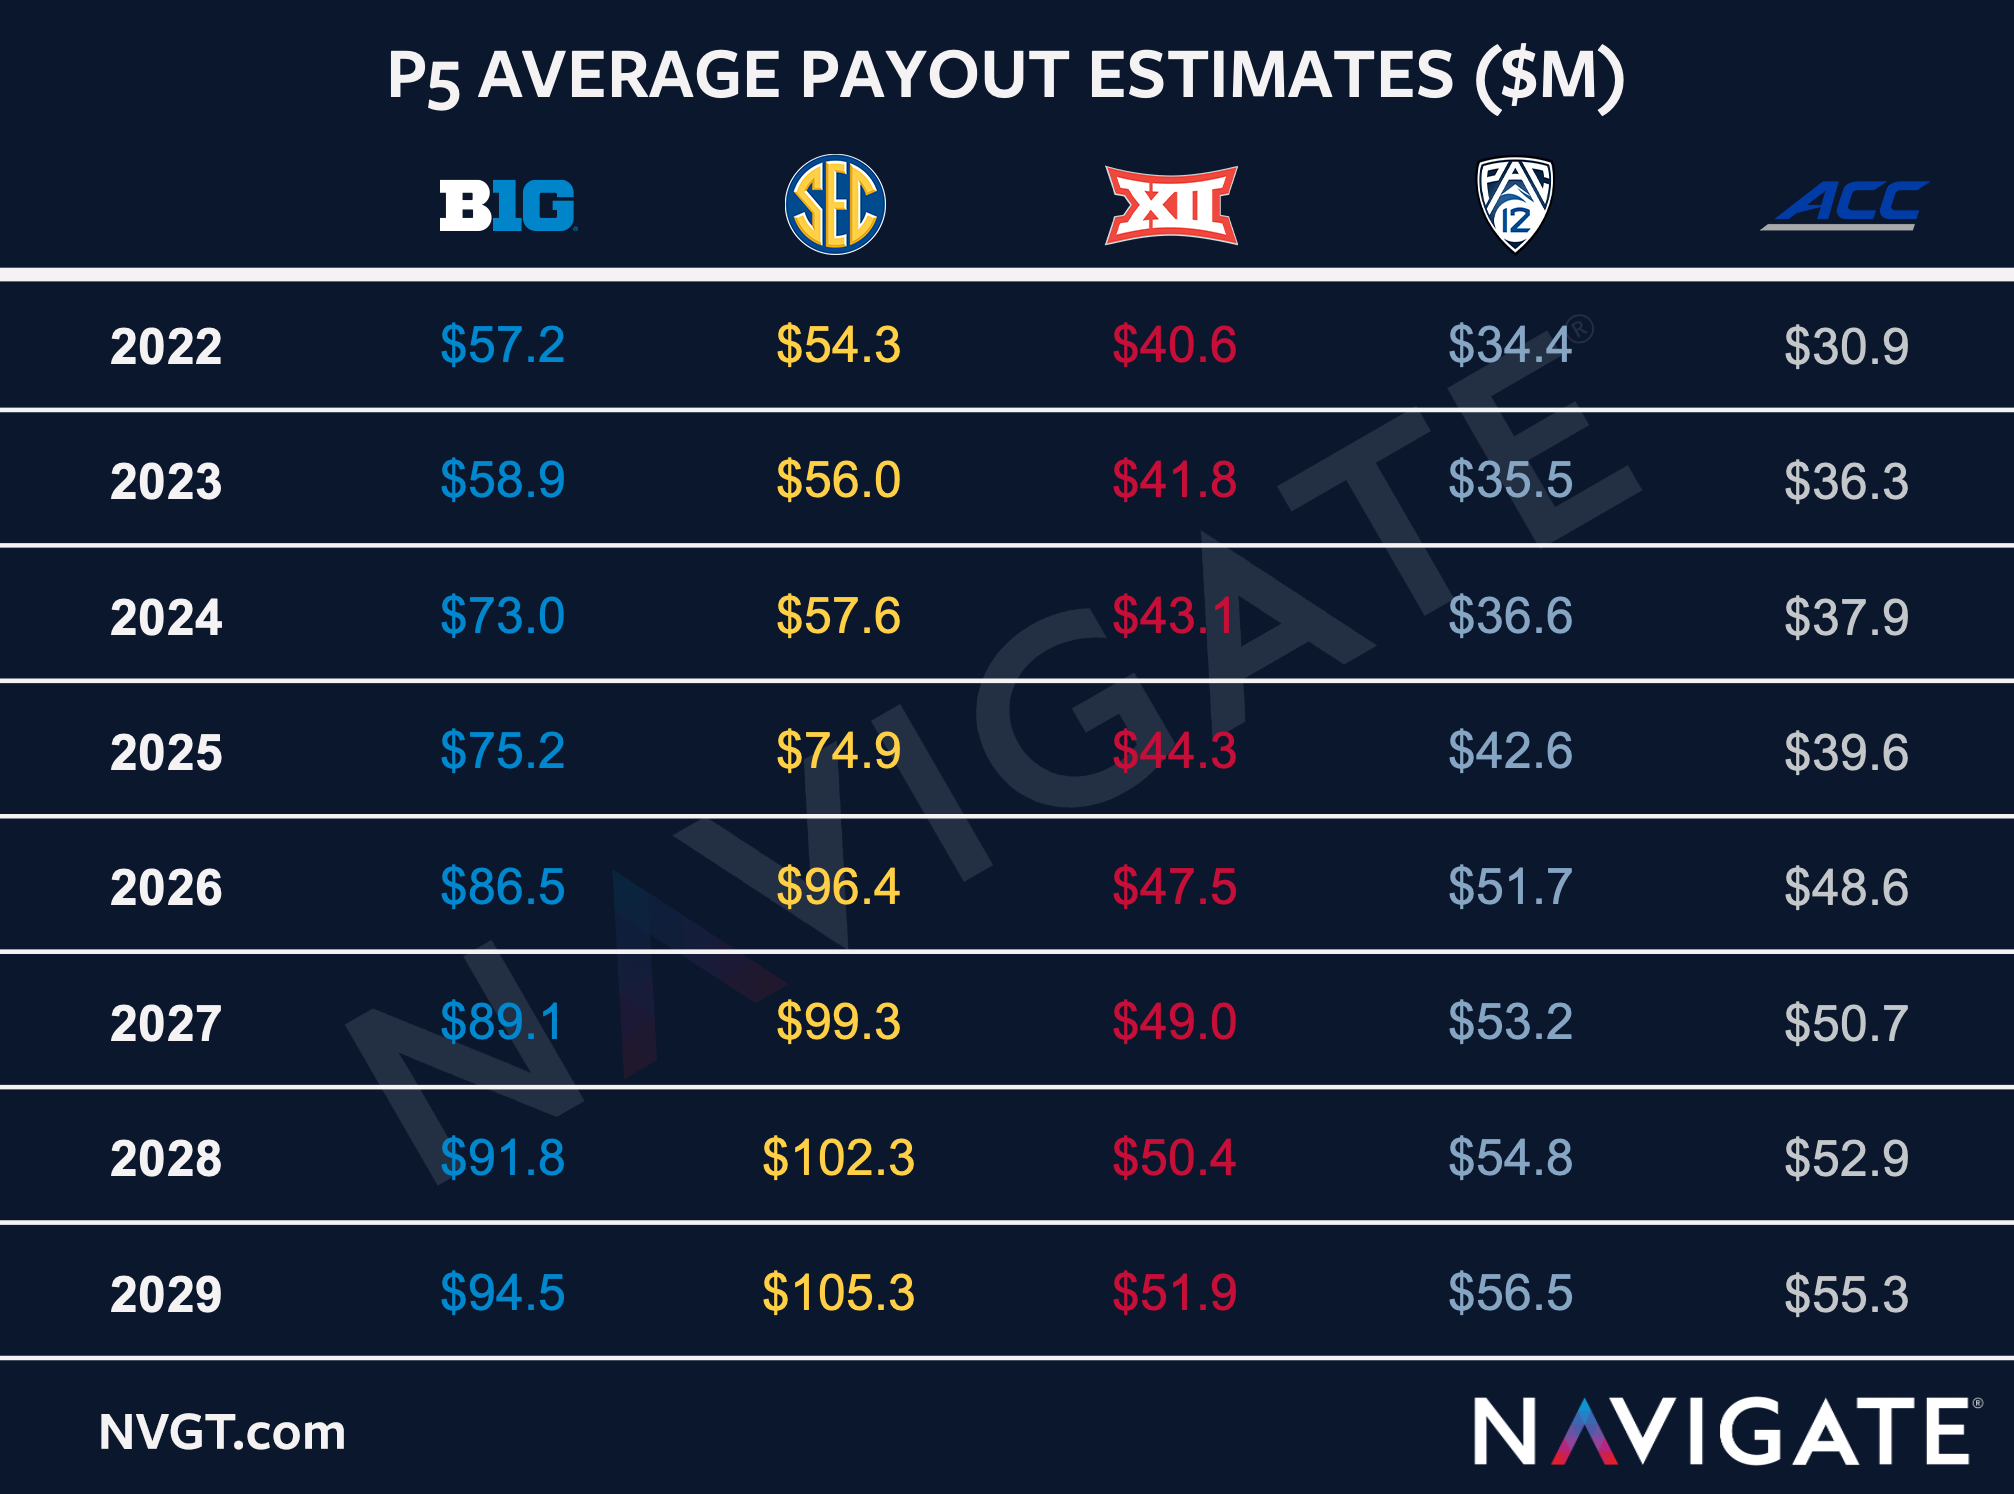
Our team estimated the rise in average Power 5 conference payouts over the next 8 years. You can see from the chart above that each conference’s average payout is expected to increase significantly during that time. We project that the SEC will overtake the Big 10 for the top spot, paying out over $100M to member universities by the end of this decade.
A few considerations to keep in mind when analyzing these results:
These estimates include all Tier I, II, and III media rights for each conference.
These estimates are based on historical growth rates in college and pro media rights deals.
These estimates include a new CFP agreement in 2026 with expansion to 8.
It is widely expected that expansion will occur in some form over this time period. We used an 8-team expansion, rather than the commonly discussed 12-team expansion in an effort to factor in the additional revenue, but remain conservative in our estimation.
These estimates include current realignment (SEC & Big 12) and their impact on media rights values.
These new estimates also include how the ACC Network will have a full year of distribution beginning in FY 2023.
These estimates do NOT reflect any strategies conferences may adopt in the structuring of their media rights, the negotiation process, or other potential moves to maximize value.
These estimates do NOT reflect adjustments from advance payouts of conference distributions or other COVID related adjustments that are not public knowledge.
These estimates include additional revenue from NCAA units, bowl payouts, conference championships and other revenue streams beyond media rights; all of these revenues are assumed to have steady growth rates.
The following chart further breaks down our year-by-year projections for average per-school payouts from each P5 conference.