thatguy2016
Well-known member
- Joined
- Feb 8, 2017
- Messages
- 10,964
- Reaction score
- 4,032
How is there social distancing? We’re full capacity.
Maybe on the hill…
it's a joke (a good one) re: WF football attendance
How is there social distancing? We’re full capacity.
Maybe on the hill…
Do you have a link for the source analysis?
Do you have a link for the source analysis?
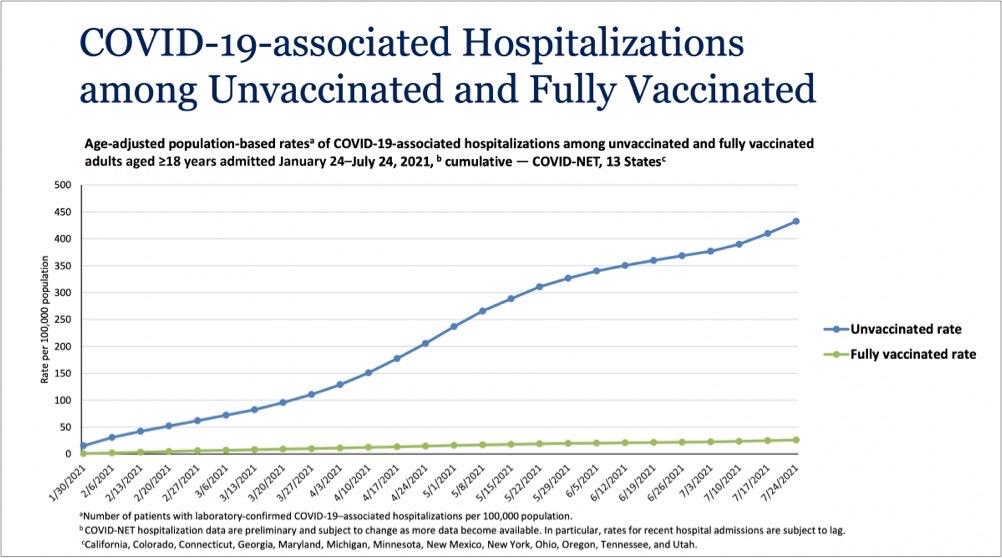
130,000 Americans were hospitalized with Covid-19 on January 11, 2021
US population at 328 million per google.
130,000 of 328 million equals a rate of about 39 per 100,000. Which isn’t that far from where that graph starts on 1/30.
And this graph is only for 13 states.
It was a slide from the WH press briefing yesterday.
https://www.whitehouse.gov/briefing...response-team-and-public-health-officials-51/
Which I saw via Jason Kottke
https://kottke.org/21/08/even-with-delta-variant-the-amazing-vaccines-are-saving-lives
https://covid.cdc.gov/covid-data-tracker/#hospitalizations
CDC data shows 7-day average of 88,527 hospitalized nationally on January 31.
84,456 7-day average hospitalized nationally on August 22
Chart above shows August at 10X January 30 - these are incompatible
https://covid.cdc.gov/covid-data-tracker/#hospitalizations
CDC data shows 7-day average of 88,527 hospitalized nationally on January 31.
84,456 7-day average hospitalized nationally on August 22
Chart above shows August at 10X January 30 - these are incompatible
Wait, are vaccinations really higher among latinos and blacks than whites?
I hope those numbers are right!
they aren't
That chart is limited to 13 states
It is per 100,000 unvaccinated people (blue line) and per 100,000 vaccinated people (green) and it is only for 13 states, not total US population.
13 states
This shit isn’t drawn with a sharpie you probably don’t need to go in with the assumption that it’s wrong.
The chart is cumulative, so it starts low and builds over time.
This shit isn’t drawn with a sharpie you probably don’t need to go in with the assumption that it’s wrong.