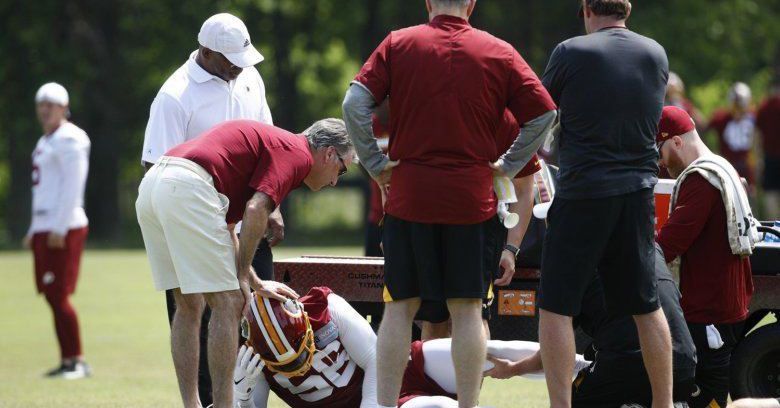
Scooooooooooop !!!!Stroud has the build to take NFL abuse long term. Young is iffy.
You are using an out of date browser. It may not display this or other websites correctly.
You should upgrade or use an alternative browser.
You should upgrade or use an alternative browser.
2023 Carolina Panthers thread - HOF Julius Peppers
- Thread starter PhDeac
- Start date
- Latest activity Latest activity:
Demonwolverine
Well-known member
- Joined
- Apr 8, 2011
- Messages
- 7,678
- Reaction score
- 1,542
Kiper shaking it up for the clicks with his new overall rankings. Has Levis as the 4th best player overall (above Stroud at 5), Richardson up to 6, Bijan down to 9 and Zay Flowers up to 10 and the top WR.
Kind of hard for me to believe that Anthony Richardson is a safer pick than Bijan Robinson…
Kind of hard for me to believe that Anthony Richardson is a safer pick than Bijan Robinson…
myDeaconmyhand
First man to get a team of horses up Bear Mountain
Kiper kinda clickbaiting with that. Levis trending more towards mid round pick based on all the mock drafts I’ve seen recently. I think Levis and Richardson basically switched places in prognostication after their respective pro days - Richardson now likely the 3rd QB taken in the top 10.
WFcatamount22
Well-known member
There is zero correlation between size and injury rate, and if anything smaller players are less injury prone.Stroud has the build to take NFL abuse long term. Young is iffy.
Understanding Injuries in the NFL Part 3
A look at what really correlates with injuries in the NFL using analysis from Football Outsiders
Are smaller players more injury-prone?
There are many ideas about what makes a player more injury prone, and many people point to size as a possible culprit. Namely, some people claim that smaller players are more likely to get injured playing football because their bodies are less suited to handle NFL collisions. This is at least a fairly straightforward question to study, as originally done here. However, we should separate this by position group, as we saw in Part 1 of this series that different position groups have different rates of injury, and more mobile positions (RB, WR, DB, LB) tend to have the highest rate of injury, while less mobile positions (OL, QB) tend to have the lowest rate of injury. The overall injury rate by position is summarized in the table below. Remember than an Athlete Exposure (AE) is defined as a game played or a practice session in which a player was listed as a full participant.Injury Rate By Position
| Position | Injury Rate per 1000 AEs (Standard Error) |
|---|---|
| RB | 20.7 (0.5) |
| DB | 17.4 (0.3) |
| WR | 17.1 (0.4) |
| LB | 17.1 (0.3) |
| TE | 16.9 (0.5) |
| DL | 15.1 (0.3) |
| OL | 12.8 (0.3) |
| QB | 8.6 (0.4) |
| ST | 4.4 (0.3) |
| Total | 15.1 (0.1) |
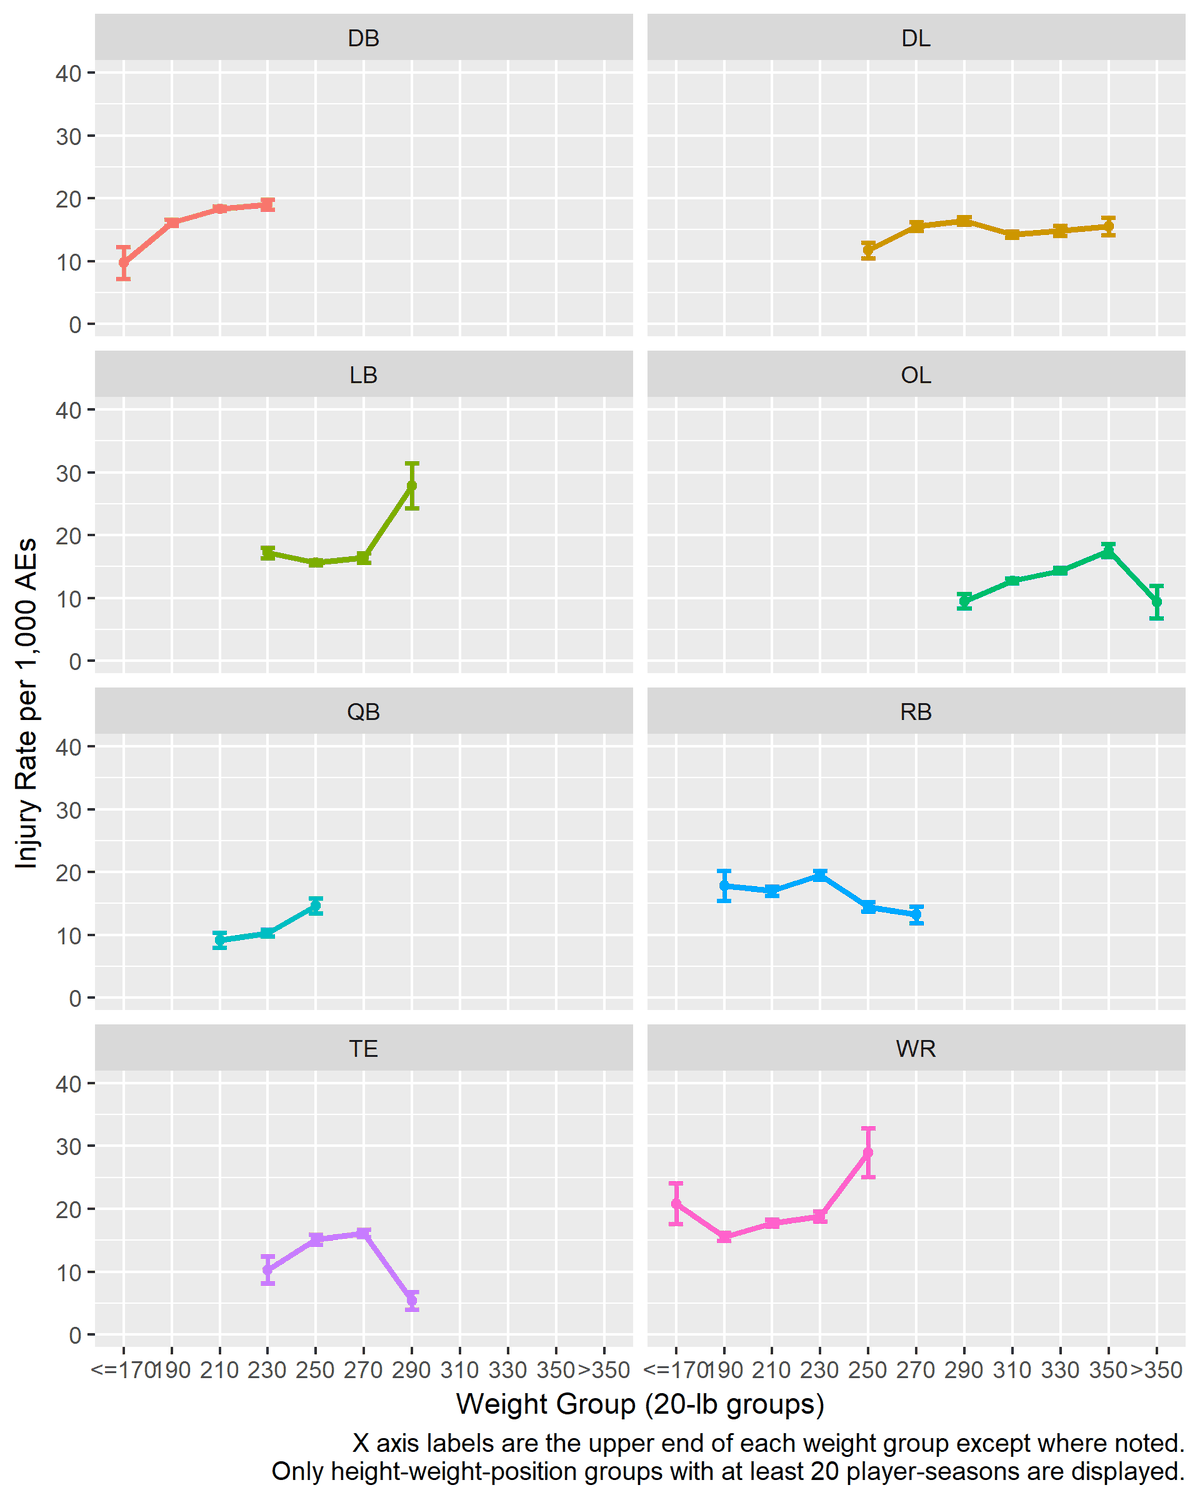
For the most part, it actually looks like smaller players are less likely to be injured, not more likely. However, each graph has a slightly different pattern that is worth describing.
- DB is perhaps the easiest plot to interpret, and shows a clear increasing risk of injury based on size.
- DL shows a similar pattern, but the effect is not as large and it is overall a much flatter plot, indicating size is not strongly correlated to injury for DL. The up-down-up shape of the curve may be due to conflation of DEs and DTs.
- LB actually shows a slightly decreased risk of injury for larger LBs up until the heaviest weight category, which has significantly increased risk.
- OL shows a clearly increasing risk of injury based on size, except for the highest weight category, which has greatly decreased risk of injury (this may be the threshold at which OL can simply win with size).
- QB also shows a clearly increasing injury rate based on size.
- RB shows an increasing injury rate based on size up to a point, then a decreasing injury rate. This pattern may again be because two slightly different position groups (HBs and FBs) are being lumped in the same category together.
- TE also shows an increasing injury rate up to a point, then a decrease. It may be due to larger TEs being used primarily as blockers rather than pass catchers.
- WR shows a strong correlation between increased size and increased rate of injury, although the very smallest weight category of WR also had an increased rate of injury.
cville deac
Well-known member
- Joined
- Apr 14, 2011
- Messages
- 15,226
- Reaction score
- 904
Kiper has pretty consistently liked Levis more than most draftniks for the last few months.
Screamindemon3
Well-known member
There is zero correlation between size and injury rate, and if anything smaller players are less injury prone.
Understanding Injuries in the NFL Part 3
A look at what really correlates with injuries in the NFL using analysis from Football Outsiderswww.hogshaven.com
Are smaller players more injury-prone?
There are many ideas about what makes a player more injury prone, and many people point to size as a possible culprit. Namely, some people claim that smaller players are more likely to get injured playing football because their bodies are less suited to handle NFL collisions. This is at least a fairly straightforward question to study, as originally done here. However, we should separate this by position group, as we saw in Part 1 of this series that different position groups have different rates of injury, and more mobile positions (RB, WR, DB, LB) tend to have the highest rate of injury, while less mobile positions (OL, QB) tend to have the lowest rate of injury. The overall injury rate by position is summarized in the table below. Remember than an Athlete Exposure (AE) is defined as a game played or a practice session in which a player was listed as a full participant.
Injury Rate By Position
Clearly, if we just looked at injury rate vs weight, it would appear that smaller players are more likely to be injured, but that is only because the most injured position groups happen to have smaller, more mobile players. Having established this baseline, we can then plot the injury rate vs weight for each of these position groups.
Position Injury Rate per 1000 AEs (Standard Error) RB 20.7 (0.5) DB 17.4 (0.3) WR 17.1 (0.4) LB 17.1 (0.3) TE 16.9 (0.5) DL 15.1 (0.3) OL 12.8 (0.3) QB 8.6 (0.4) ST 4.4 (0.3) Total 15.1 (0.1)
For the most part, it actually looks like smaller players are less likely to be injured, not more likely. However, each graph has a slightly different pattern that is worth describing.
Overall, these data seem to indicate that smaller players are actually a bit less prone to injury within a given position group, although usage seems to play a much bigger role than size in determining injury rate. My big takeaway from this is not that teams should target smaller or larger players, but rather just that teams should not assume that smaller players are more prone to injury, as injury history is a much better predictor of future injury than size. Players like Russell Wilson and Christian McCaffrey are perfect examples of undersized players who were healthy in college
- DB is perhaps the easiest plot to interpret, and shows a clear increasing risk of injury based on size.
- DL shows a similar pattern, but the effect is not as large and it is overall a much flatter plot, indicating size is not strongly correlated to injury for DL. The up-down-up shape of the curve may be due to conflation of DEs and DTs.
- LB actually shows a slightly decreased risk of injury for larger LBs up until the heaviest weight category, which has significantly increased risk.
- OL shows a clearly increasing risk of injury based on size, except for the highest weight category, which has greatly decreased risk of injury (this may be the threshold at which OL can simply win with size).
- QB also shows a clearly increasing injury rate based on size.
- RB shows an increasing injury rate based on size up to a point, then a decreasing injury rate. This pattern may again be because two slightly different position groups (HBs and FBs) are being lumped in the same category together.
- TE also shows an increasing injury rate up to a point, then a decrease. It may be due to larger TEs being used primarily as blockers rather than pass catchers.
- WR shows a strong correlation between increased size and increased rate of injury, although the very smallest weight category of WR also had an increased rate of injury.
TE looks like a flaccid penis WR looks like an erect penis #scoop
Screamindemon3
Well-known member
*with peyronie's disease
tigerswood
Well-known member
Never forget Kiper’s hard on for Jimmy Clausen.
Screamindemon3
Well-known member
Falcons just sent a 2023 5th to the Lions for Okudah
Deaconblue
Well-known member
- Joined
- Apr 23, 2011
- Messages
- 19,848
- Reaction score
- 3,436
Bigger linebackers probably the outside linebackers in 3/4 defenses. Hence doing more pass rushing against offensive tackles. Thus colliding frequently with guys a lot bigger than they are.
PhDeac
PM a mod to cement your internet status forever
- Joined
- Mar 16, 2011
- Messages
- 155,608
- Reaction score
- 22,614
Falcons just sent a 2023 5th to the Lions for Okudah
That’s a lot less than the Panthers gave up for CJ.
So much #analysis on this thread. I #LOVE it.
Demonwolverine
Well-known member
- Joined
- Apr 8, 2011
- Messages
- 7,678
- Reaction score
- 1,542
All people are different people.
PhDeac
PM a mod to cement your internet status forever
- Joined
- Mar 16, 2011
- Messages
- 155,608
- Reaction score
- 22,614
I saw a list of top 10 Ohio State players in NFL history. About half of the pictures were in black and white. So I pulled up a list of current OSU players and it's a list of dudes, some you've heard of some you haven't, but few were notable.
But created equal. At least that’s how the saying goes.All people are different people.
WindyCityDeac
Well-known member
I never understand this argument.Who's the last tOSU QB to turn into a Top 10 NFL QB? I'll wait...
How do you compare OSU QB's under Jim Tressel to those under Ryan Day ?
And shouldn't the question be who's the last (insert school here) QB that met their draft expectation ? Wouldn't that be more telling ?
WindyCityDeac
Well-known member
I've even heard it said that it's self evidentBut created equal. At least that’s how the saying goes.
warak
Well-known member
- Joined
- Mar 24, 2011
- Messages
- 8,400
- Reaction score
- 862
i am not sure looking at QBs from tOSU will be a great representation of what Stroud will do in the NFL. so many QBs are taken and don't produce...hell only 1/2 of the league has what we would consider a GOOD QB, let alone Franchise.