You are using an out of date browser. It may not display this or other websites correctly.
You should upgrade or use an alternative browser.
You should upgrade or use an alternative browser.
BillBrasky Memorial Political Chat Thread
- Thread starter myDeaconmyhand
- Start date
- Latest activity Latest activity:
TownieDeac
words are futile devices
- Joined
- Mar 16, 2011
- Messages
- 76,189
- Reaction score
- 16,925
Ackerman nails it

 www.rollingstone.com
Henry Kissinger, War Criminal Beloved by America's Ruling Class, Finally Dies
Henry Kissinger has died at age 100, his consulting firm said in a statement on Wednesday.
www.rollingstone.com
tiltdeac
Well-known member
- Joined
- Mar 23, 2011
- Messages
- 4,502
- Reaction score
- 980
Is it really an economic reality though? This narrative is super common, romanticizing the past, but a whole lot of it seems to be vibes. IN the 1950s home ownership rates were 55%. Today it's 66%. Home ownership rates in those under 35 have been essentially stable for 50 years, but have risen over the last decade. Percent of income spent on housing has gone down, not up.It’s great there are macroeconomic indicators that look good, but relative to what? Sure, people in the middle and latter end of their careers are pleased the stock market has turned around, the job market has stabilized, and inflation is back in hand, but it’s still an economic reality that it’s really hard for young people to afford college or homes or cars, compared to a generation ago.
Perhaps the social media angle is that younger people have more (if skewed) political consciousness because of places like Twitter and TikTok. Of course some of those communities are toxic, but the ability to converse in political speak is democratized more than it was a generation ago, and you pair those two things together, and you’ve got a decent narrative for why young people might be less than satisfied with your objective numbers.

In the 1960s people spent close to 20% of their income on food! It's under 8% today. A Dodge caravan was more expensive, inflation adjusted in 1996 than it was in 2020 (not even accounting for the quality and safety improvements). Median net wealth is the highest it's ever been for single parents, African Americans, and people under 35.
I'm not trying to pretend everything is perfect, or even very good. And some things really have gotten harder. Rents for example, have trended upward (graph below). There is a ton to be done there. But when we look at inflation adjusted measures (that definitionally account for all of this stuff), I think it's really hard to support the idea that it's significantly harder for young people today. I'm not trying to scold anyone. The shaming happening that strick mentioned earlier is super dumb. Tons of people are still suffering. But I dunno. It just seems impossible to to build the coalitions we will need going forward to enact policy to materially improve peoples' lives when there is this hugely pervasive "things are shittier than ever burn it all down" energy that seems, to me at least, to be unjustified.


Thread
Wokeandbroke’s school choice play book!
dartsndeacs
THE quintessential dwarf
This is a good post. Is it just alot more expensive to buy a house in the neighborhoods people graduating from Wake Forest want to live in? Because my house I grew up in sold for $130k in 2019 and my mom bought it 35 years ago for $100k. Good school system, 30 minute drive to Philly, nice town, just zero amenities.Is it really an economic reality though? This narrative is super common, romanticizing the past, but a whole lot of it seems to be vibes. IN the 1950s home ownership rates were 55%. Today it's 66%. Home ownership rates in those under 35 have been essentially stable for 50 years, but have risen over the last decade. Percent of income spent on housing has gone down, not up.
View attachment 6910
In the 1960s people spent close to 20% of their income on food! It's under 8% today. A Dodge caravan was more expensive, inflation adjusted in 1996 than it was in 2020 (not even accounting for the quality and safety improvements). Median net wealth is the highest it's ever been for single parents, African Americans, and people under 35.
I'm not trying to pretend everything is perfect, or even very good. And some things really have gotten harder. Rents for example, have trended upward (graph below). There is a ton to be done there. But when we look at inflation adjusted measures (that definitionally account for all of this stuff), I think it's really hard to support the idea that it's significantly harder for young people today. I'm not trying to scold anyone. The shaming happening that strick mentioned earlier is super dumb. Tons of people are still suffering. But I dunno. It just seems impossible to to build the coalitions we will need going forward to enact policy to materially improve peoples' lives when there is this hugely pervasive "things are shittier than ever burn it all down" energy that seems, to me at least, to be unjustified.
View attachment 6911
deac_tracy
Well-known member
- Joined
- Mar 17, 2011
- Messages
- 2,127
- Reaction score
- 361
I know everybody's celebrating Kissinger's death but this is pretty amazing as well. Crowd's reaction is priceless. Audio NSFW.
Highland Deac
Well-known member
- Joined
- Nov 26, 2012
- Messages
- 6,866
- Reaction score
- 749
And what's really sad and frightening is that it's all working for them beautifully, especially here in NC. They've been following that plan to the letter and so far it's paid off for them perfectly. And most of the larger public seems clueless as to what's going on.Yep. And that's how you defund public education.
myDeaconmyhand
First man to get a team of horses up Bear Mountain
myDeaconmyhand
First man to get a team of horses up Bear Mountain
Strickland33
Well-known member
I know everybody's celebrating Kissinger's death but this is pretty amazing as well. Crowd's reaction is priceless. Audio NSFW.
How did such a dumb fuck make so much money?
TownieDeac
words are futile devices
- Joined
- Mar 16, 2011
- Messages
- 76,189
- Reaction score
- 16,925
I question a lot of this underlying data, especially as regards housing, if it takes into consideration factors like older and younger people sharing generational homes.Is it really an economic reality though? This narrative is super common, romanticizing the past, but a whole lot of it seems to be vibes. IN the 1950s home ownership rates were 55%. Today it's 66%. Home ownership rates in those under 35 have been essentially stable for 50 years, but have risen over the last decade. Percent of income spent on housing has gone down, not up.
View attachment 6910
In the 1960s people spent close to 20% of their income on food! It's under 8% today. A Dodge caravan was more expensive, inflation adjusted in 1996 than it was in 2020 (not even accounting for the quality and safety improvements). Median net wealth is the highest it's ever been for single parents, African Americans, and people under 35.
I'm not trying to pretend everything is perfect, or even very good. And some things really have gotten harder. Rents for example, have trended upward (graph below). There is a ton to be done there. But when we look at inflation adjusted measures (that definitionally account for all of this stuff), I think it's really hard to support the idea that it's significantly harder for young people today. I'm not trying to scold anyone. The shaming happening that strick mentioned earlier is super dumb. Tons of people are still suffering. But I dunno. It just seems impossible to to build the coalitions we will need going forward to enact policy to materially improve peoples' lives when there is this hugely pervasive "things are shittier than ever burn it all down" energy that seems, to me at least, to be unjustified.
View attachment 6911
Here’s median house sale price:

Median Sales Price of Houses Sold for the United States
Graph and download economic data for Median Sales Price of Houses Sold for the United States (MSPUS) from Q1 1963 to Q3 2023 about sales, median, housing, and USA.
fred.stlouisfed.org
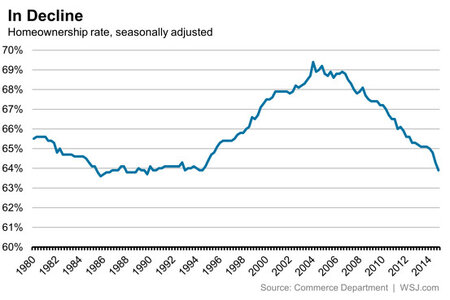
And you can pick a time and say ownership rates look good against them like the 50s or you can note the steady 20 year decline:

And if you look at young families ownership is and has been static and low:

I noticed you didn’t touch college costs:

Or wage growth’s staggering inequality:

Feels like a rosy picture you’re hand picking against larger trend.
Attachments
Louis Gossett Jr
Well-known member
- Joined
- Sep 4, 2012
- Messages
- 12,905
- Reaction score
- 6,805
The homeowner bump shown is artificially inflated and essentially we have return to the baseline before the late 90s early 2000s.
tiltdeac
Well-known member
- Joined
- Mar 23, 2011
- Messages
- 4,502
- Reaction score
- 980
Steady 20 year decline you say? Your graph stops at the low point in 2014. It's currently at 66% from an all time high of 69%I question a lot of this underlying data, especially as regards housing, if it takes into consideration factors like older and younger people sharing generational homes.
Here’s median house sale price:
Median Sales Price of Houses Sold for the United States
Graph and download economic data for Median Sales Price of Houses Sold for the United States (MSPUS) from Q1 1963 to Q3 2023 about sales, median, housing, and USA.fred.stlouisfed.org
And you can pick a time and say ownership rates look good against them like the 50s or you can note the steady 20 year decline:
View attachment 6916
And if you look at young families ownership is and has been static and low:
View attachment 6918
I noticed you didn’t touch college costs:
View attachment 6919
Or wage growth’s staggering inequality:
View attachment 6920
Feels like a rosy picture you’re hand picking against larger trend.

tiltdeac
Well-known member
- Joined
- Mar 23, 2011
- Messages
- 4,502
- Reaction score
- 980
And I'm not disputing that wage gains were higher at the top historically. It's only in the last few years that gains were higher for the bottom. But even your own chart shows people at the 10th and 50th percentile are WAY better off than before. That's great news!

Deacsfan27
Well-known member
Maybe not the right thread for this, but can somebody smarter economically than me help shed light on how much of some of our typical consumer goods (groceries, food, retail stores) are inflation vs. just good ole capitalistic price gouging to exploit folks?
- Joined
- Mar 25, 2011
- Messages
- 23,316
- Reaction score
- 6,433
Joe Biden is the only president in the post Kissinger SoS era that did NOT invite him to the white house.