lbE08
Stegosaurus are bush league
- Joined
- Mar 16, 2011
- Messages
- 28,890
- Reaction score
- 2,657
When people disagree with you, it is because they aren't smart enough to understand your nuanced genius.
What about when people disagree with you?
When people disagree with you, it is because they aren't smart enough to understand your nuanced genius.
What about when people disagree with you?
Wow. You are clueless.
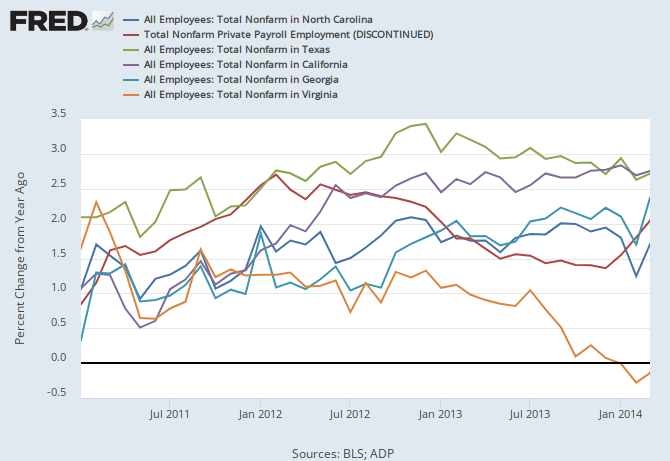
I have got to stop playing around with BLS charts and do some work. Here is a chart showing the percentage change of actual non-farm payroll jobs nationally, in NC, CA, TX, GA, and VA since 2011. What you see is CA and TX beating the national average, NC and GA tracking the national number or lagging, and VA sucking.
What percentage of people on UI actively choose to stay on it because it's easier than working? I know there's no real answer but I can't imagine the number is very high while I would guess JHMD thinks it's very high. I think it's a complete boogeyman which is why I have such a disconnect with JHMD's views.
As usual 923 kills it on this thread with actual facts.
Rather than getting into slap fights with Ph, care to comment on this jh?
What's a non-farm payroll job?
Also, I didn't need a chart to know that Virginia sucks.
if you're engaging in this conversation and have to ask this question...
"payroll" seems like an odd qualifier, as does "non-farm". Why factor them out?
Also, either I'm going colorblind or I can't tell which shade is supposed to be NC and which one is GA. A little help?
dude, seriously?
Nonfarm Payroll is a catchall group that includes basically all business/manufacturing jobs (and about 80% of the workforce), but excludes government positions, home business (like farms), and aid-providing non-profit jobs. it gives a much better read on the true economic condition and is the monthly statistic that's taken and used for policy making/adjusting.
Also, either I'm going colorblind or I can't tell which shade is supposed to be NC and which one is GA. A little help?
And as such, it's the most readily available Fed statistic that can be used to compare jobs apples to apples between states. It also has the benefit of being kept on a monthly basis, so you can get more recent data that some other stats, for example state GDP which is only available through the end of 2011 right now.
I imagine Virginia constantly trails the national average since you're not counting government positions. I hear there is one or two in North Virginia. Surprised California is doing so well given that farm employees don't count in the figure. I guess you can factor them "out" on the theory that those jobs represent inelastic demand, but the Indianas, Iowas, and Kansas's of the world probably get quite a skew on that basis.
Texas seems to have everyone else clipped by a good margin.
...you remove them out of the whole percentage equation, though. not just the numerator. you get that, right? the whole point of the NFP stat is that it removes the skew created by high numbers of govt/farm/etc employees.
Hate to crush this tangent but government jobs are included in NFP
http://www.bls.gov/news.release/empsit.t17.htm
Well there ya go. That's news to me; I feel like in discussion/application it was always excluded, or at least isolated.
It would be unkind to respond, "dude, seriously?", so I won't. We're all learning here.
It would be unkind to respond, "dude, seriously?", so I won't. We're all learning here.